However, there is a technique I have used over the years that plays on risk-based approaches. This technique can be applied to testware, such as test cases. Just remember this is not a scientific model, just an estimation technique.
What is Testware?
Testware is anything used in software testing. It can include test cases, test scripts, test data and other items.
The Problems with Test Cases
Test cases are tricky to use for estimation because:
They can represent a wide variety of strength, complexity and risk
They may be inconsistently defined across an organization
Unless you are good at measurement, you don’t know how much time or effort to estimate for a certain type of test case.
You can’t make an early estimate because you lack essential knowledge – the number of test cases, the details of the test cases and the functionality the test cases will be testing.
Dealing with Variations
“If you’ve seen one test case, you’ve seen them all.” Wrong. My experience is that test cases vary widely. However, there may be similarity between some cases, such as when test cases are logically toggled and combined.
A technique I have used to deal with test case variation is to score each test case based on complexity and risk, which are two driving factors for effort and priority.
The complexity rating is for the test case, not the item being tested. While the item’s complexity is important in assessing risk, we want to focus on the relative effort of performing the test case. You can assign a number between 1 and 10 for the complexity of a test case. It may be helpful to create criteria for this purpose. Here is an example, You can modify it for your own purposes.
1 – Very simple
2 – Simple
3 – Simple with multiple conditions (3 or less)
4 – Moderate with simple set-up
5 – Moderate with moderate set-up
6 – Moderate with moderate set-up and 3 or more conditions
7 – Moderate with complex set-up or evaluation, 3 or more conditions
8 – Complex with simple set-up, 3 or more conditions
9 – Complex with moderate set-up, 5 or more conditions
10 – Complex with complex set-up or evaluation, 7 or more conditions
This assessment doesn’t consider how the test case is described or documented, which can have an impact on how easy or hard a test case is to perform.
Assessing Risk
Risk assessment is both art and science. For estimation, you can be subjective. In fact, my experience is that risk assessment is subjective at some point or other.
This scale is based on the risk (impact) of the test case and its priority in the test. Like the complexity ranking, here are sample criteria you can adapt for your own situation:
1 – Lowest priority, lowest impact
2 – Low priority, low impact
3 – Low priority, moderate impact
4 – Moderate priority, moderate impact
5 – Moderate priority, moderate impact, may find important defects
6 – Moderate priority, high impact, has found important defects in the past
7 – High priority, moderate impact, new test
8 – High priority, high impact, may find high-value defects
9 – High priority, high impact, has found high-value defects in the past
10 – Highest priority, highest impact, must perform
Actually, the risk level could be seen from two perspectives - the risk of the item or function you are testing, or the risk of the test case itself. For example, if you fail to perform a test case that in the past has found defects, that could be seen as important enough to include every time you test. Not testing it would be a significant risk. The low risk cases would be those you could leave out and not worry about. Of course, there is a tie-in between these two views. The high-risk functions tend to have high-risk test cases. You could take either view of test case risk and be in the neighborhood for this level of test estimation.
Charting the Test Cases
To visualize how this technique works, we will look at how this could be plotted on a scatter chart. There are four quadrants:
1 – Low complexity, low risk
2 – High complexity, low risk
3 – Low complexity, high risk
4 – High complexity, high risk
Each test case will fall in one of the quadrants. One problem with the quadrant approach is that any test case in the center area of the chart could be seen as borderline. For example, in Figure 1, TC004 is in quadrant 4, but is also close to the other areas as well. So, it could actually be in quadrant 1 if the criteria are a little off.

Figure 1
For this reason, you may choose instead to divide the chart into nine sections. This “tic-tac-toe” approach gives more granularity. If a test case falls in the center of the chart, it is clearly in section 5 (Figure 2), which can have its own set of test estimation factors.

Figure 2
All You Need is a Spreadsheet
With many test cases, you would never want to go to the trouble of charting them all. All you need to know is in which section of the chart a test case resides.
Once you know the complexity and risk scores, all you need to know are the sections on the chart. For example, if the complexity is 3 or less and the risk is 3 or less, the test case falls in section 1 of the nine-section chart. These rules can be written as formulas in a spreadsheet (Figure 3).

Figure 3
Sampling
So, what if you don’t have a good history of how long certain types of test cases take to perform? You can take samples from each sector of the chart.
Take a few test cases from each section, perform the test cases and measure how long it takes to set-up, perform and evaluate each test case.
You now extend your spreadsheet to include the average effort time for each test case (Figure 4).
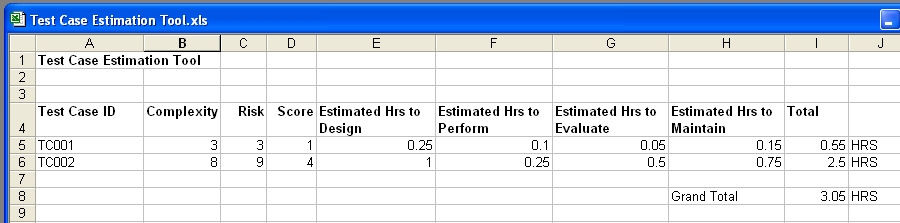
Figure 4
Adjusting
Your estimate is probably inaccurate. There is a tendency to believe the more involved and defined the method is, the more accurate the estimate will be. However, the reality is that any method can be flawed. In fact, I have seen very elaborate estimation tools and methods which look impressive, but were inaccurate in practice.
It’s good to have some wiggle-room in an estimate as a reserve. Think of this factor as dial you can turn as your confidence in the estimate increases.
Conclusion
Like with any estimation technique, at the end of the day, there could be any number of things that could impact the accuracy of most estimates. Estimates based on test cases can be helpful once you have enough history of measuring them.
Sampling can be helpful if you have no past measurements, or if this is a new type of project for your organization. It is still a good idea to measure the actual test case performance times so you can incorporate them in your future estimates.
I hope this technique helps you and provides a springboard for your own estimation techniques.
No comments:
Post a Comment